
Over $81 million in verdicts and settlements in 20 years.
Portland Bicycle Accident Lawyer
Portland Bureau of Transportation Bike Law
- quick summary of Portland Bike Laws to get you going
Following some of the big news in Oregon bicycle law and Portland bicycle laws.
-
Do bike lanes exist in intersections?
-
Cyclists can treat stop signs as yield (Idaho Stop) a.k.a. Oregon rolling bicycle law.
-
The joy of the bike bus and safe routes to school.
-
Green bike boxes and blue bike lanes history in Portland and right hook bicycle v. car accidents.
- Vision Zero, so much hope, still hoping but the rise of the zero vision and little progress.
Portland Traffic Cameras Effective, but offline July - November 2025
And 11 people have died in traffic crashes in that time span, according to the Portland Police Bureau. Several of those fatalities occurred near intersections with inoperative speed cameras. [...] 43% decline in car crashes where cameras were installed, compared to the years prior. [...] Last year, 58 people were killed in car crashes on Portland streets. When Vision Zero was adopted in 2015, 35 people died from vehicles that year. In all, more than 500 people — pedestrians, cyclists, motorcyclists and drivers and their passengers — have been killed on Portland streets in the past decade.
Unfortunately, according to Portland's latest bicycle count, bicycling in Portland is still down with 2024 numbers looking about the same as 2023.
Biking rose in the mid-2010s, then began to decline through 2019. The pandemic resulted in a steeper drop beginning in 2020 and reflected in the count data from 2022, when PBOT resumed counting. While biking increased last year and has held steady this year, biking is still down about 40% compared to the mid-2010s peak.
[...] Portland can be a world-class bicycle city, but only if we're committed to making it that way.
Allowing rolling stops on bicycles doesn't cause risky road behavior, study finds
September 1, 2024 - Allowing cyclists to roll through stop signs doesn't lead to riskier road behavior, according to a new study from researchers at Oregon State University.
The Bicycle Rolling Stop Law in Oregon Research at Oregon State University:
Bicycle Rolling Stop (BRS) laws refer to legislation that allows bicyclists to treat stop signs as yield signs. Many states have passed statutes or attempted to pass similar statutes with varying permissive actions for bicyclists in response to stop signs. Previous research has focused on crash data analysis and motivating factors of bicyclists performing a rolling stop when illegal under prevailing law. However, there is still no available research that evaluates the efficacy of BRS laws or analyzes the effect of BRS in states where it is permitted.
Bike Bus Bill - signed
Directs State Board of Education to adopt rules that allow for reimbursement of school district expenses incurred for alternative transportation costs.
Oregon mulls 'bike bus bill' to fund alternative transportation to school
Mar. 06, 2023 - Currently schools can only use state funding for bus transportation.
It's named after the chaperoned bike rides that have become popular at some schools, where an adult will bike a route much like a school bus, picking up students along the way to join the growing group ride to class. The bill would allow school districts to use money from their existing transportation budgets to fund alternative transportation for students — such as to pay for chaperones to walk or bike kids to school, crossing guards, or public transit passes for students.
Some of the written testimony from the Bike Bus Bill is just fantastic to read and see the images.
From bicycle transportation coach whose written testimony is only out done with the pictures of kids with huge smiles on bicycles, Megan Ramey, Safe Routes to School Manager for Hood River County School District:
Like many small towns and cities in Oregon, Hood River is bisected by a 4-lane highway, an incredible barrier for children to traverse from their house to the school. Naturally, parents only feel comfortable with their children riding the bus or driving them and the small number of kids who walk or bike to school are those who don't traverse the barrier or don't have a choice.
Or the great Coach Balto with the now world famous Portland public school Alameda Bike Bus testimony:
You may know that several months ago my school Alameda Elementary created a Bike Bus in which hundreds of students bike to school weekly. It is a phenomenal success. It started with 75 students and now has over 190 students who have participated which is over a 1/3rd of the student body. Students and families are overwhelmingly enthusiastic and students report a greater sense of togetherness, greater physical activity and well being and a stronger sense of self. Bike Bus videos have gone viral with 10s of millions of views and we were featured on NBC Nightly News.
Yes so much joy, it made the NBC Nightly News.
January 1, 2020 Oregon cyclists can use the Idaho Stop.
Bicyclists can treat stop signs like yield signs, Oregon Senate says
Oregon bicycling advocates have pushed for the rule change for more than a decade, arguing it's a common sense law that's worked for more than 35 years in Idaho. Other states have followed suit and passed legislation similar to the so-called Idaho Stop.
Cyclists to Treat Stop Signs Like Yield Signs
A similar "stop and go" bill was introduced in 2003, but didn't make it out of Senate committee; in 2009, Rep. Jules Bailey offered another iteration of the Idaho Stop, but was unsuccessful. A decade later, he says, legislators "have done a better job of setting expectations around the bill, and a better job of addressing legitimate concerns."
Update 2018 - 2019
The Bulletin (Bend / Central Oregon) October 16, 2018
FedEx driver not guilty in accident that killed cyclist
Judge rules man killed in intersection was not protected by bike lane
A Deschutes County Circuit Court judge on Tuesday ruled a cyclist hit and killed in an intersection by a FedEx truck did not have the protection of a bike lane [...] Prosecutor Andrew Steiner said many people today do not treat bike lanes like vehicle lanes, though they are. [...] Steiner attempted to make the case that bike lanes continue through intersections, citing Oregon Department of Transportation guidelines for road construction and recent court cases and legislation in Oregon.
Oregon House Bill 2682 became law with the help of a lot of public servants and bicycle community outreach. This is an article from Bend Bikes about the need to have the law specifically state that a bike lane continues through an intersection - the "bike lane" bill.
Here is an op-ed from the co-sponsors of this bike lane bill Oregon state representatives from Portland and Beaverton:
Schouten, Nosse: Let's protect bicyclists at intersections
State legislators say biking is eco-friendly option and Oregon should do more to be bicycle-friendly
March 27, 2019
This is madness. To avoid visual confusion, we don't paint every lane line in our intersections. And nobody claims automobile travel lanes don't exist within an intersection. So the failure to acknowledge that bike lanes continue through intersections is both strange and troubling. Now, to correct the confusion, we are co-sponsoring legislation (House Bill 2682) that will explicitly extend this legal protection to cyclists crossing intersections.
As of April 16, 2019 Oregon House Bill 2682 which "clarifies that bicycle lane continues in and through intersection where markings are interrupted by intersection" was been approved by its Oregon Legislature Joint Committee On Transportation.
If the bill is becomes law, it will ammend Oregon Revised Statute 801.155 Relating to bicycle lanes:
"Bicycle lane" means that part of the highway, adjacent to the roadway, designated by official signs or markings for use by persons riding bicycles except as otherwise specifically provided by law. Where the markings of a bicycle lane are interrupted by an intersection, the bicycle lane continues in and through the intersection.
And one more important update May 2019: Bike lanes exist in an intersection, Oregon lawmakers affirm (May 7, 2019 The Oregonian)
Oregon lawmakers confirmed Monday that a bike lane still exists when interrupted by an intersection, despite the absence of paint on the roadway. The Oregon Senate voted Monday to clarify the state's definition of a bike lane, adding language that the lane "exists in an intersection if the bicycle lane is marked on opposite sides of the intersection in the same direction of travel."
It took 10 years, but, Governor Kate Brown signed it into Law on May 14, 2019 and it will go into effect January 1, 2020.
Vision Zero Act 2015
Reps Blumenauer and Buchanan Introduce Vision Zero Act to End Transportation-Related Fatalities
"Vision Zero" is the goal of eliminating all transportation-related fatalities, including pedestrians, bicyclists, transit users, motorists and passengers.
- Being struck by a motor vehicle is the leading cause of injury-related death for children under 14.- Being struck by a motor vehicle is the second leading cause of injury-related death for seniors.
- A person hit by a car while crossing the street has a 5% chance of death if the car is going 20 mph.
- If the car is going 40 mph, chance of death is 70%.
- Lower-income neighborhoods have much higher pedestrian fatality rates than higher-income areas.
- Fatalities on our roadways have declined overall, but the number of pedestrians killed annually rose 16% from 2009 to 2014.
Portland Bureau of Transportation (PBOT) 2024 traffic crash data
Traffic deaths were particularly bad in 2023. Portland saw 69 deaths that year, and PBOT's traffic safety manager said they were "heading in the wrong direction."
But the data this year show modest improvement. Deaths of people driving motor vehicles declined 28% since 2023, although they remain higher than pre-pandemic levels.
The number of deaths for pedestrians, bicyclists and motorcyclists remained comparable to 2023.
Portland Vision Zero
Of course Portland is a city that embraced Vision Zero. With Federal transportation support and local advocates, engineers and traffic design experts, our transportation future is looking brighter.
Portland Transportation Vision Zero Action 2023 - 2025 Update
Portland Transportation Vision Zero Action Plan (2016)
Vision Zero is the bold goal to eliminate all traffic deaths and serious injuries on Portland streets by 2025. Vision Zero reaches beyond traditional transportation agency safety programs. It is a multi-agency, multi-partner initiative that requires cooperation, commitment, urgency, and action across the community.
The Portland high crash map
Portland streets and intersections where serious injury and fatality crashes occur at higher rates.
"High Crash Network streets and intersections in Portland. High Crash Network streets make up 8 percent of Portland streets but account for more than half of traffic deaths."
You can see the map and also view the streets and intersections as a list. The list also helps you drill down and understand the data allowing you to see the data also by filtering pedestrians, bicycles, motorcycle, and motor vehicles, or all types etc..
Portland High Crash Intersections Map
Portland High Crash Streets Map
"In 2022, 63 people died in traffic crashes in Portland. That is the same number of people killed in 2021, and a higher death toll than we've seen in at least three decades."
- Portland 2022 Deadly Traffic Crash Report (PDF): Learn about trends from this past year
- Oregon Department of Transportation: Provides summary reports and raw data upon request
Green Bike Lanes, Blue Bike Lanes, Portland Bicycle History
City of Portland Transportation Office Green Bike Box Press Release (internet archive)
THE BIKE BOX: GET BEHIND IT!
Portland celebrates new "green space" intersection safety design
Portland's newest green space is designed to reduce crashes and save lives. The bike box is an intersection safety design to prevent bicycle/car collisions, especially those between motorists turning right and bicyclists going straight. City Commissioner Sam Adams was joined today by Representative Jackie Dingfelder, Metro Councilor Rex Burkholder, and representatives of the bicycle community to celebrate the first new bike box installations for bicyclists crossing Hawthorne Boulevard at 7th and 11th Avenues. A "bike box" - or advanced stop line - is an idea that originated in Europe. It gives cyclists a legal place to idle when waiting for a red light to turn green.
Before Green Bike Boxes, and Bike Lanes, Portland Had Blue Bike Lanes.
Blue Bike Lanes Denoted A Conflict Area In An Experiment To Improve Bicycle Safety
Before the green bike boxes, trouble spots were marked with blue paint in the bike lane.
As of spring 2009, the city still maintains the below page and information on the blue bike lane markings. However, on inspection, some previously blue bike lanes are now green while some bike routes are still marked with the Blue Bike Lane (for instance heading West toward the Hawthorne Bridge) to indicate an area that cars and bikes need to be extra alert to each other. Blue Bike Lanes were an experimental attempt for roadway markings to warn cars and bicyclists of dangerous bike lane and car crossings.
Motorists may be unaware that it is illegal to drive and park in bicycle lanes. Even more critical, they are unaware of the need to yield to cyclists when crossing a bicycle lane to turn right or get into a right-turn only lane. The result of this is a relatively high level of conflicts in these areas--both in terms of crashes and "near misses."
1999 NACTO PDF On Portland's Blue Bike Lanes.
Portland transitioned to Green instead of Blue in 2009.
And, they set out to study if there was any safety improvement in these blue bike lanes.
- Did motorists appear to yield more frequently to cyclists after the pavement was colored blue?
- Did motorists appear to look for cyclists before crossing the bike lane more frequently than before?
- Did motorists modify their behavior in any significant ways?
- Did cyclists tend to look more frequently for motorists before proceeding through the painted area?
- Did cyclists modify their behavior in any significant ways? 6 Did the number of conflicts, near conflicts, and reported crashes change?
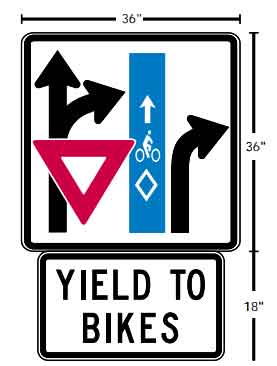
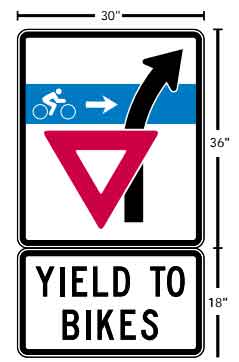
You can see the list of blue bike lanes that were installed and where they were installed for this study in 1999. The signs that went with these locations are also interesting, and these are the 4 conflict types that the researchers were isolating in this study.
Group 1, Right-turn exit ramps. Motorists yield to cyclists as they turn right to exit roadway.
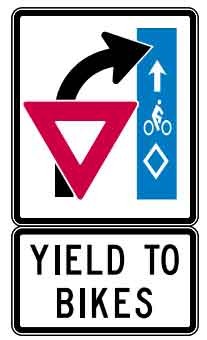
Group 1, Right-turn exit ramps. This was a unique sign used for Broadway and Williams.
This is also explained in the site descriptions. For Broadway / Williams, this was a bad crossing for bicycle riders in the designated bike lane because they had to travel through traffic turning onto the Interstate 5 onramp, a site with a history of too many bicycle vs. car conflicts.
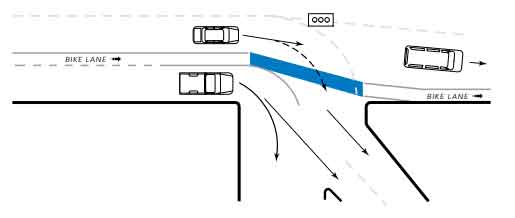
Also, notorious crossings where bicyclists have to navigate similarly on a bike path which goes straight through the right turn of cars turning through the bike lane in Portland:
- Hawthorne Bridge / McLoughlin off-ramp
- Beaverton-Hillsdale Highway / Bertha
- SW Multnomah Blvd, Eastbound at Garden Home Road
Group 2, Right-turn lanes. Motorist entering right-turn lane yields to cyclist.
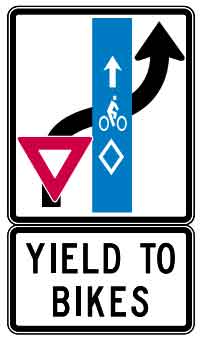
Four intersections within Portland with high numbers of bicycle vs. car crashes were included in this group:
- SE Madison / Grand
- SE 7th / Morrison
- East end of Broadway Bridge / Larrabee
- SW Terwilliger / I-5 entrance
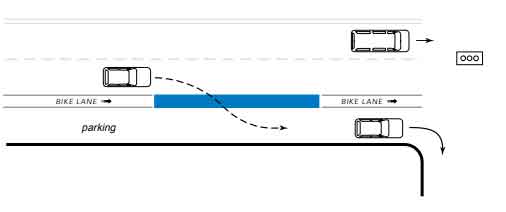
Group 3, Entrance ramps. Motorist yield to cyclists as they turn right to enter roadway.
There were 2 places with this type of bicycle lane crossing a high use car offramp from Interstate 5:
- NE Weidler, Eastbound at Victoria (I-5 northbound off-ramp)
- East end of the Broadway Bridge, westbound at Interstate
The rest is history. They concluded more study needed to be done on the signs influence because they clearly assigned priority right-of-way which may have been more important than the color of the paint on the roadway. But, the majority of drivers also gave the painted color on the road a positive review for getting their attention. Results were positive, and eventually they were expanded to the bike boxes and the color changed, as well as the sites getting this treatment being exanded to more roads throughout Portland Metro.
Safer streets. Safety in numbers.
Portland bicycle commuters know by experience the difference in the numbers of other cyclists on the road can make. Bicycle safety advocates believe that the more the numbers of bicycles grow on our streets, the better car drivers and pedestrians and bikes will all get along. And, there are a lot of statistics, especially in recent years, from all around the country in microcosm studies, or macro across the USA, that this is true. However, we are also seeing new concerning problems in bicycle accident safety statistics.
This idea of the numbers, critical mass idea, if from the P. L. Jacobsen Safety in numbers: more walkers and bicyclists, safer walking and bicycling
The common wisdom holds that the number of collisions varies directly with the amount of walking and bicycling. However, three published analyses of collision rates at specific intersections found a non-linear relationship, such that collisions rates declined with increases in the numbers of people walking or bicycling.
The state of cycling in the USA at the end of 2012 no doubt, bicycle riders were enjoying improving conditions and bicycle ridership and commuting is definitely growing. But hard safety questions are materializing in how to move forward.
For instance in Colorado, the Colorado 2009 laws (Senate Bill 09-148) to clarify the rights and laws of bicycle and car co-existence on Colorado streets, roads and highways:
[...] provides provisions for cyclists to ride two abreast, for passing motorists to cross the center line, and for cyclists to ride only as far to the right as is reasonable, so as to avoid hazards. Motorists are required to leave a three-foot buffer when passing a cyclist, and threatening or careless driver behavior, including throwing projectiles at a cyclist, is designated as a misdemeanor. Cyclists are also permitted to ride on the left-hand side of a one-way street, to mitigate the hazard parked buses and taxis present on the right.
Leaving space while passing a bicycle rider is just common sense to many of us, but in 2012, Pennsylvania also put this law on the books making it legally permissible for the auto driver to cross the line on the road in order to leave this safe passing room while over taking a bicycle.
Pennsylvania's new bicycle law is just common sense
April 9,2012 - [...] Unfortunately, not all drivers are that polite, which is the reason that Pennsylvania lawmakers thought they had to put into writing a requirement that motorists leave a 4-foot "cushion of safety" when passing bicyclists. When oncoming traffic permits, motorists are permitted to cross the center line to provide space when passing bicyclists.
A study in Maryland where they also have a new bicycle passing law (as of October 2010) requiring three feet found that cars routinely violate this law.
Cyclists in Baltimore, MD were routinely passed at a distance of three feet or less while cycling during morning and evening commutes, which indicates that the three-foot law is not being followed and cyclist safety may be compromised. Risk factors for dangerous passes by motorists were decreasing lane width and the absence of bicycle lanes. [...] The construction of bicycle lanes is a transportation infrastructure solution that would engineer out deficiencies in motorist behavior toward cyclists.
Many cities across the nation see rising numbers of serious bicycle accident and fatalities. Yes, bicycle ridership is up, but the correlation and meanings of the numbers are not really clear to the safety experts and city designers what exactly is happening. This is also occurring in some of the best biking cities in the USA, not the worst.
DENVER BIKE ACCIDENTS ON TRACK FOR ALL TIME HIGH [July 2012]
This year, through July 8th, there have already been 228 accidents, which nearly matches the total number of collisions throughout the entire year in 2011, and already has surpassed 2010 as a whole. The statistics aren't broken down by type, so they could refer to bike-pedestrian, bike-bike or bike-auto accidents. In 2011, DPD had 239 on record, and in 2010, the total came to 202. Assuming that more cycling accidents will continue to take place over the summer and into the fall -- especially since there are more cyclists on the road in Denver -- we can expect the city to not only break its record on bike accidents by year's end, but shatter it.
In Portland, we got similarly troubling news in October of 2012 about the green bike boxes which, granted were an experimental road way design, but, well, we hoped. We do need better and more thorough safety studies of what is actually happening with these green bike boxes, road designers, city engineers to all study the facts, which will be coming.
Right-hook crashes increasing -- not decreasing -- at some Portland green bike boxes [October 16, 2012]
"The crash data trend suggests that right-hook crashes are increasing at some of the treatment locations installed in the first phase," said city traffic engineer Rob Burchfield in a signed "progress report" to federal highway officials that was released late Monday (PDF).
In August 2012, another intersection in Portland, NE Wheeler, was closed because of the right hook - right turn problems between bikes and vehicles
Portland closing N. Wheeler to right turns to prevent bike, car collisions
August 21, 2012 - [...] North Wheeler Avenue at Broadway will be closed starting Wednesday morning to right-turn traffic. He said the closure is in response to 20 reported crashes at the intersection between 2000 and 2010, including 17 right-hook collisions involving a person on a bike and a car.
It takes time to compile statistics. So, we don't yet know what 2012 statistics will really look like. To be sure, there are good and bad spots, even some very good and hopeful stats.
Portland has a lot to be proud of with our bicycle history, like Portland's Green Bike Boxes.
Green bike boxes attempt to improve bicycle safety at dangerous intersections, especially where cars are turning right through a bike lane while the bikes are going straight. Bicyclists might know this type of danger as being "right- hooked."
Green bike boxes attempt to improve bicycle safety at dangerous intersections, especially where cars are turning right through a bike lane and the bikes are going straight. Cyclists might know this type of danger has "right- hooked."
In 2007 Portland had 6 car bicycle collisions resulting in fatalities. After two cyclists died in October 2007 both as a result of getting right-hooked (when a car crosses the bike lane to turn right and strikes a cyclist), the city of Portland responded with the innovative "Green Bike Boxes." The box road marking instructs bikes to stop in front of cars which increases their visibility. The painted green bike lane in the intersection where cars turn right reminds bikes and drivers to look for each other.
According to Adams, a comprehensive evaluation of the bike boxes will be conducted by Portland State University's Initiative for Bicycle and Pedestrian Innovation. The outcome will provide recommendations for their future use, design and evaluation. "We feel that by experimenting with the Bicycle Boxes and Colored Bicycle Lanes," said Adams, "we have the potential to further the development of new standards for treatments that ensure bicyclists' safety, in Portland, and potentially other cities."
In California, at the end of 2011, many Southern California cities were dealing with much higher bicycle accident numbers than they had seen in previous years.
Rise in number of bicycle accidents has Burbank concerned [November 13, 2011]
Through October of this year, police have responded to 32 injury bike collisions — more than in all of 2007, when there were 24, and nearly as many as the 33 reported in 2008, Lt. J.J. Puglisi said.
Burbank police officers also noted the increase not just in the number of these accidents but also the severity. Burbank also has some great bicycle boulevards and an ambitious bicycle master plan they released in 2009.
New York City has a promising bike sharing program, and increasing miles of bike paths and designated bike lanes. In NYC we see the challenges facing bicycle riders, pedestrians, and car drivers, in a blown up sort of way - way bigger numbers of all types of transit users. In New York City there have been growing tensions between bicycle v. pedestrian accident and fatalities. In New York, a huge number of people are pedestrians, and the bicycle riders have been growing in numbers the last several years especially.
Study Finds Higher Number of Pedestrians Hurt by Bikes [September 19, 2011]
More than 500 New York City residents are injured badly enough to be treated in hospitals after being struck by bicyclists each year, according to an analysis by Hunter College professors. The number, while small compared with the number of pedestrians injured by cars, is a much higher figure than an earlier study by the same researchers found.
The professors surveyed hospital data gathered by the State Department of Health between 2007 and 2010 and found that roughly 1,000 pedestrians in New York State were seen at hospitals each year after being hit by cyclists, and that 55 percent of the accident victims were in New York City. A 2009 analysis of different data by the professors, Peter Tuckel and William Milczarski, found that only a few more than 1,000 pedestrians were treated annually in hospitals in the whole country for injuries in collisions with cyclists.
The tension between pedestrians and bicycle riders in New York City continued into 2012. Interesting data sets were compiled. Of course, car v. pedestrian injury and fatalities are much higher numbers than bicycle v. pedestrian. In addition, bicyclists themselves are injured or killed in much higher numbers by accidents involving cars, or often, trucks. The data has been hopeful. Bike paths, bike lanes do help. The numbers of bicycle riders on the streets in New York City are growing at fantastic rates, and yet, these incidents are actually reducing in frequency.
At Least 24 Cyclists Were Killed In NYC Last Year, But Gawker Wants More [8/27/2012]
Leitch complains that "Bike riders have taken over this city," and says that his wrath against cyclists arises from his identity "as a pedestrian, as someone giddy to live in one of the few cities in America where you can just walk everywhere." But as a pedestrian, Leitch should be encouraging cycling: as cycling rates nearly doubled from 2007 to 2010, the number of bike-on-pedestrian crashes dropped 9%. The number of cyclist-caused crashes fell as well.
Cars are 365 times more dangerous to pedestrians than cyclists, according to City data. 60% of fatal pedestrian and bicyclist crashes are caused by illegal driver behavior. 27% of crashes that kill or seriously injure pedestrians involve a driver failing to yield. More pedestrians are struck by vehicles crossing the street with the signal (27%) than without (20%).
The rate of bicycle riding growth in New York City has gotten contentious. Bicycle riders are getting tickets and very high rates, while, the cyclist community contends that drivers, and crash-causing-injury-making drivers are not getting ticketed, it is bringing the actual data to light, especially over the last year.
NYPD: 1,304 Pedestrians and Cyclists Injured, 13 Killed in Traffic in October [November 29, 2012]
Of seven fatal crashes reported by Streetsblog and other outlets, no motorists were known to have been charged for causing a death. Historically, nearly half of motorists who kill a New York City pedestrian or cyclist do not receive so much as a citation for careless driving. [...] Across the city, 976 pedestrians and 328 cyclists were reported hurt in collisions with motor vehicles. Per NYPD policy, few if any of these crashes were investigated by trained officers.
There's a lot of bright spots in the contentiousness of New York City's bike growth.
New York City Department of Transportation (DOT) Commissioner Janette Sadik-Khan today announced a continued steady increase in commuter bike riding in New York City, with an 8% increase in bike riders counted at commuter locations this year compared to last year's record number. According to counts of bike riders made at six commuter locations, bike riding has increased 102% compared to 2007 and by 289% compared to 2001. In that time, safety has increased for all street users, with fatalities at their lowest levels in the century that records have been kept, while serious bike injuries and fatalities have remain unchanged despite the near-quadrupling in bike riding.